
Making a Fuel-Price Map Fast on Android and iOS
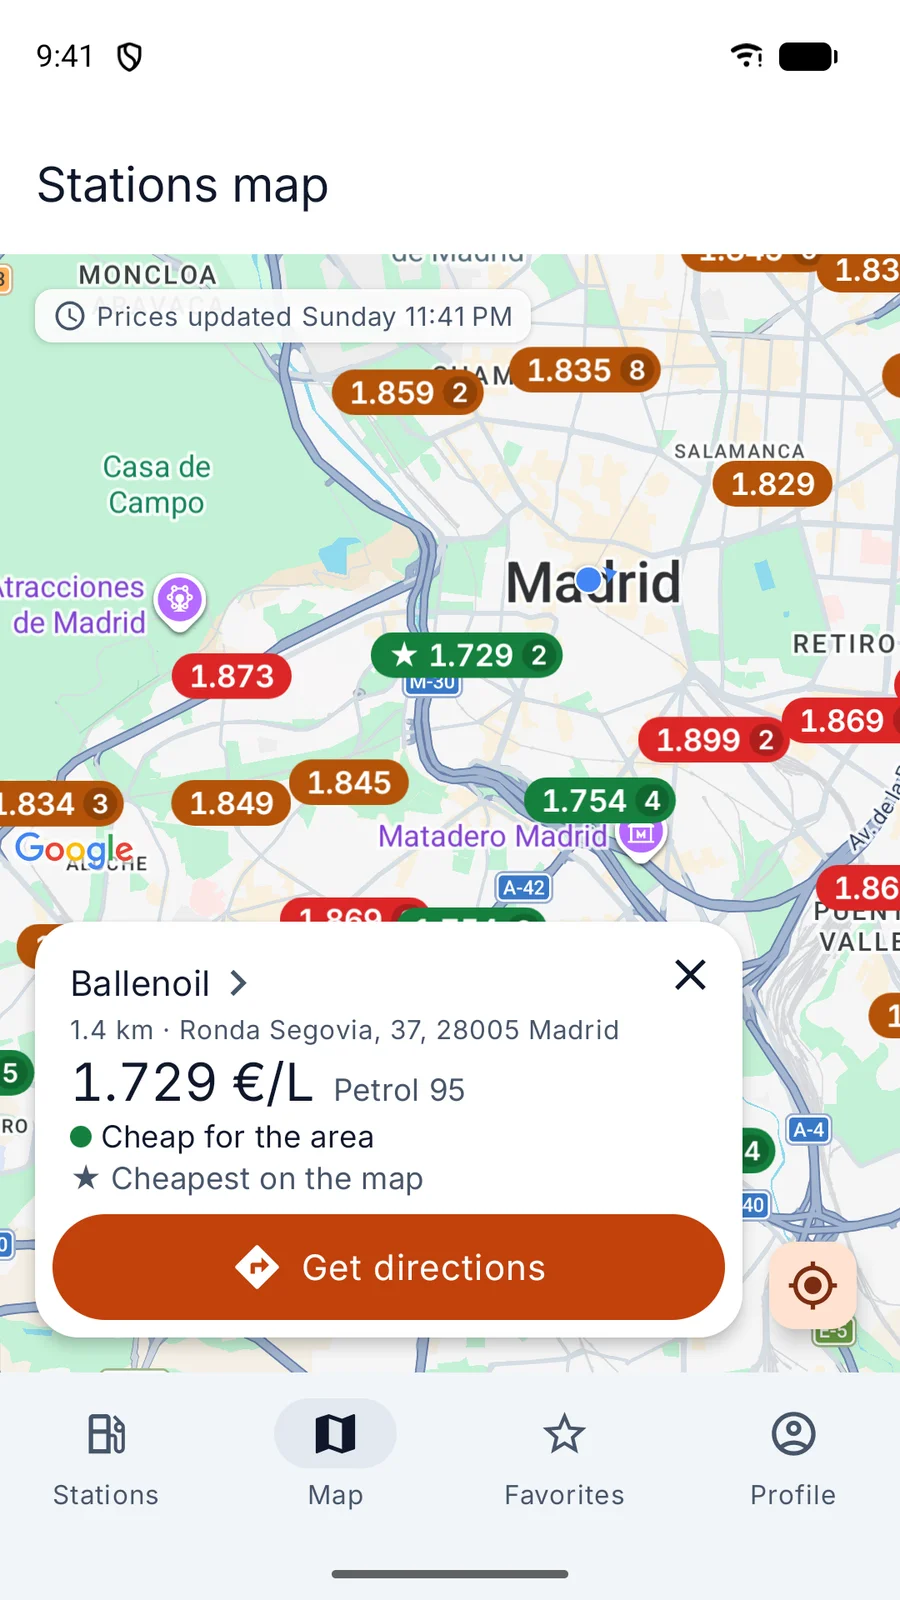
The map is the screen of Fuelvo that people judge first. It shows up to 200 stations at a time, each one a pin with its price, coloured by how cheap it is for the area, and grouped into clusters when they would cover each other. It worked from the first release, but it didn’t feel fast: panning was heavy on Android, and on both platforms the map did more work than the user could see.
Three tickets in October fixed it: FUEA-110 for how the map loads data, FUEA-111 for how
Android draws pins and FUEA-112 for how iOS does. This post covers what the problem was, what
Google and Apple’s tools expect you to do, what I changed and what the measurements can and cannot
show.
The shape of the problem
Every time the camera stopped moving, three things happened:
- A request. The shared
MapViewModelasked the backend for the stations in the visible bounding box, wrote the answer to the local cache and replaced the markers. That was true even after a 50-metre pan inside an area it had just loaded. - New pictures on Android. Each pin and each cluster was a Composable. The maps library built a view for each one on the main thread and captured it to a bitmap. A single zoom out and back in created between 156 and 267 of those views.
- A diff on every state change on iOS. MapKit’s
updateUIViewruns on every change of the screen’s state, including the loading bar, the freshness label and the preview card, and each time it rebuilt and compared all 200 annotations.
The first problem lives in shared Kotlin code, so one fix covers both apps. The other two are platform-specific, and each needed a different fix.
1. Load more than you show, and ask again only when needed
Google’s optimisation guide for Maps is written for the JavaScript API, but one rule applies everywhere: only add or remove content once the user stops panning or zooming. Fuelvo already did that (a 350 ms debounce, and a newer viewport cancels the older request). The problem was what happened after the camera stopped: every stop was treated as new.
The fix is in MapViewModel, in :core:presentation, so Android and iOS got it in the same
commit:
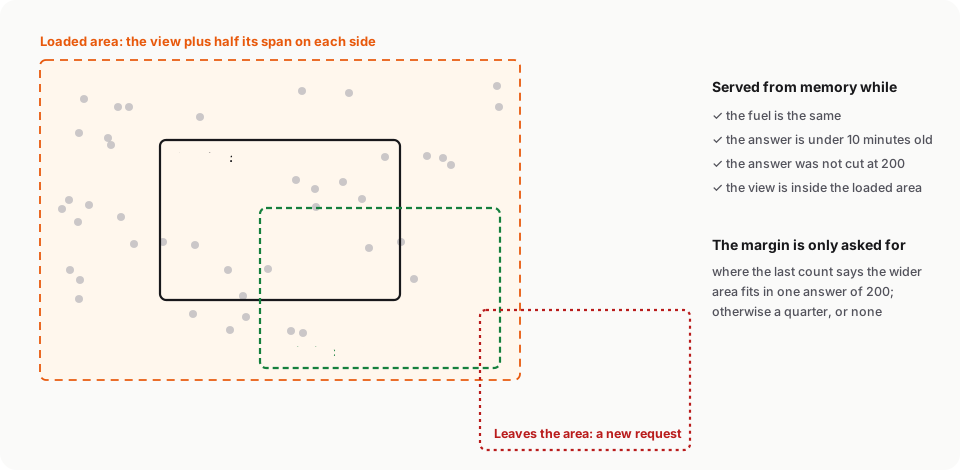
- The first view goes out on its own. After that, the ViewModel asks for the view plus half its
span on each side, and keeps the answer as a
LoadedArea. - A later view inside that area, for the same fuel, with an answer under ten minutes old, is served from memory, with no request.
- The backend returns at most 200 stations, so the ViewModel only asks for the margin where the last count says the wider area fits in one answer. Otherwise it asks for a quarter of the span, or no margin at all. If a margin answer comes back cut to the 200 cheapest, it asks again without the margin, because a cut answer could leave out stations in the view itself.
One detail is easy to miss. The pin with the cheapest price on screen gets a star, and that has to
follow the camera, not the loaded area. So withCheapestIn(viewport) recomputes it over what’s
visible, and the price colours still come from the backend’s scale for the area (the app never
ranks prices against whatever happens to be on screen).
MapViewModelTest covers the sequences: ten pans after a margin load make no request, and another
fuel, a cut answer or an old answer each trigger a new one.
2. Android: a picture per content, not a view per pin
What was slow
Fuelvo’s Android map uses android-maps-compose
and its Clustering composable. Its clusterItemContent and clusterContent slots are
convenient: you write a Composable and it becomes the marker. But for each item the library creates
a view, measures it, lays it out, draws it and captures the result as a BitmapDescriptor, on the
main thread, even when many pins look exactly the same.
The library’s maintainers know about this. Issue #272, open since February 2023, asks for a cache for those bitmaps. The reporter had 3,000 points but only about 20 different markers. It is still open, and the maintainers would rather find an optimisation that doesn’t need a cache key.
There was a second problem. The selected station was part of each cluster item, so tapping a pin gave the library a new list, and it clustered the whole map again.
What Google’s own tooling expects
Under Compose, the clustering is the
Maps SDK Utility Library:
a ClusterManager, an algorithm and a DefaultClusterRenderer, which the documentation describes
as “a good base to start from” for custom markers by subclassing it. So the fix stays within what
Google documents: use the library’s renderer and give it bitmaps instead of views. The JavaScript
optimisation guide gives the same advice: plain raster images for markers, and clustering when there
are many.
What I built
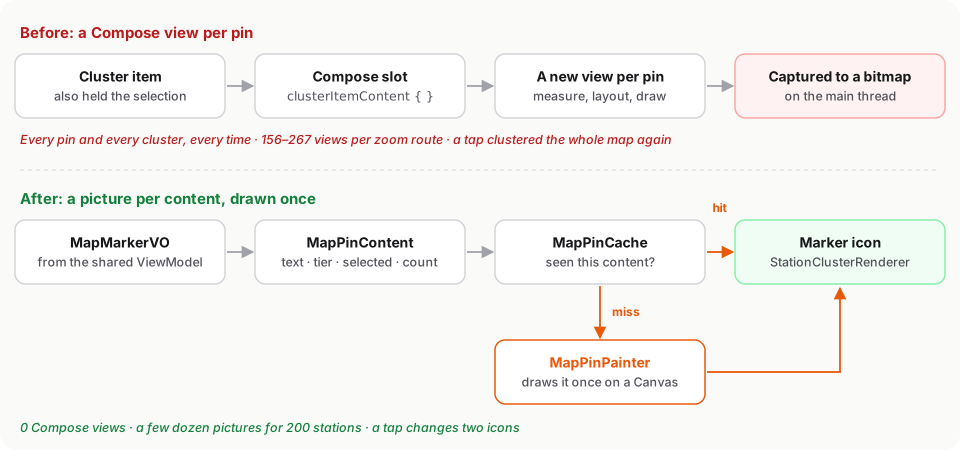
-
MapPinContentis everything a pin’s picture depends on, and nothing else: the text, the price tier, whether it’s selected and the cluster size. Two pins with the same content are the same picture.internal data class MapPinContent( val text: String, val tier: PriceTier, val isSelected: Boolean = false, val clusterSize: Int = 0, ) -
MapPinCacheis anLruCachekeyed byMapPinContent. A map of 200 stations has a few dozen different pictures, so most pins are cache hits. -
MapPinPainterdraws a pin directly onto aCanvas, using the theme’s colours and the price typeface, resolved once per theme. Each drawing is wrapped in aMapPin:rendertrace section so the benchmark can measure it. -
StationClusterRendererextendsDefaultClusterRendererand sets those bitmaps as the markers’ icons. Selection is no longer part of the items: previewing a station changes two icons (the old one and the new one) instead of handing the library a new list.
MapPinScreenshotTest is the golden for the pins (Roborazzi), because no screen-level screenshot
shows them.
The numbers, and what they can’t show
I measured with a Macrobenchmark (MapBenchmark) on the release build against production: panning
at city zoom, zooming out to the widest view and back, and panning out there. The figures below are
for the zoom route, on an emulator:
| Before | After | |
|---|---|---|
| Compose views created for pins | 156–267 | 0 |
| Main-thread time making pins | 289–533 ms | 134–216 ms |
| Frames over 16.7 ms | about the same | about the same |
The first two rows are the work the app no longer does: no views, and roughly half the
main-thread time spent producing pins. The third row looks the same before and after, and the
reason matters. On a 2-core emulator the slow frames come from the emulator’s GPU pipe
(eglSwapBuffers), not from the app, so frame times can’t show this improvement. A run on a real
low-end phone is still on my list, and I won’t quote a frame-time gain until I’ve done it.
3. iOS: MapKit was right, the code around it wasn’t
MapKit already does the two things a map with many markers needs: annotation views are reused
(dequeueReusableAnnotationView), and clustering is built in through clusteringIdentifier. The
waste was in my code around it:
updateUIViewran a full diff on every state change, even when the markers hadn’t changed.- When a station’s content changed (for example, the star moving to another station), its annotation was removed and added back, which also re-clusters and re-animates it.
- Each pin was a view tree: labels on a rounded, bordered layer, with masked labels for clusters.
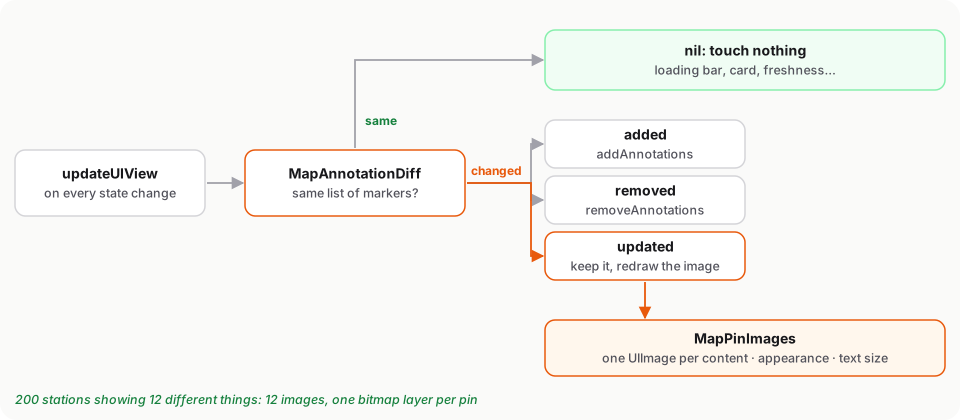
MapAnnotationDiffreturnsnilwhen the markers are the same list the map already shows, so a loading bar or the preview card no longer touches the pins. Otherwise it returns added, removed and updated. An updated station keeps its annotation and only its view is redrawn.MapPinImagesdraws eachMapPinContent(the Swift mirror of the Kotlin type) once per appearance and text size withUIGraphicsImageRenderer, and keeps it. Pins follow Dynamic Type up to 1.4×. 200 stations showing 12 different things now take 12 images instead of 200 view trees.- A clustering bug fixed along the way: the
clusteringIdentifierwas set once ininit, but reused views are given new annotations. Zooming out over Seville by hand left reused pins out of the clusters, piled on top of each other. It’s now set every time the view gets an annotation.
On iOS I haven’t measured frame times yet either: the simulator has the same limits as the
emulator. The changes are counted by tests instead (MapPinTests), and the next step is an
Instruments run on a physical iPhone with the Animation Hitches template.
What carried over between the platforms
The same idea solved the problem on both platforms: a pin is a picture of its content, and the content is the cache key. Everything else follows from that. Clustering libraries can keep their markers, selection changes two pictures instead of the whole data set, and the work scales with the number of different pins, not the number of stations.
What I’d tell another team doing this:
- Fix data loading before drawing. The cheapest pin is the one you never have to replace, and if that logic lives in shared Kotlin, both apps get it from one commit.
- Keep transient UI state out of clustered items. Selection in the item list means every tap re-clusters the map.
- Put trace sections around your own work.
MapPin:renderand its iOS signpost measure the app’s own work even when the emulator’s frame times can’t. - Know what each number can prove. The emulator proved the app does less work; it didn’t prove the map is smoother on a real device, and the post says so.